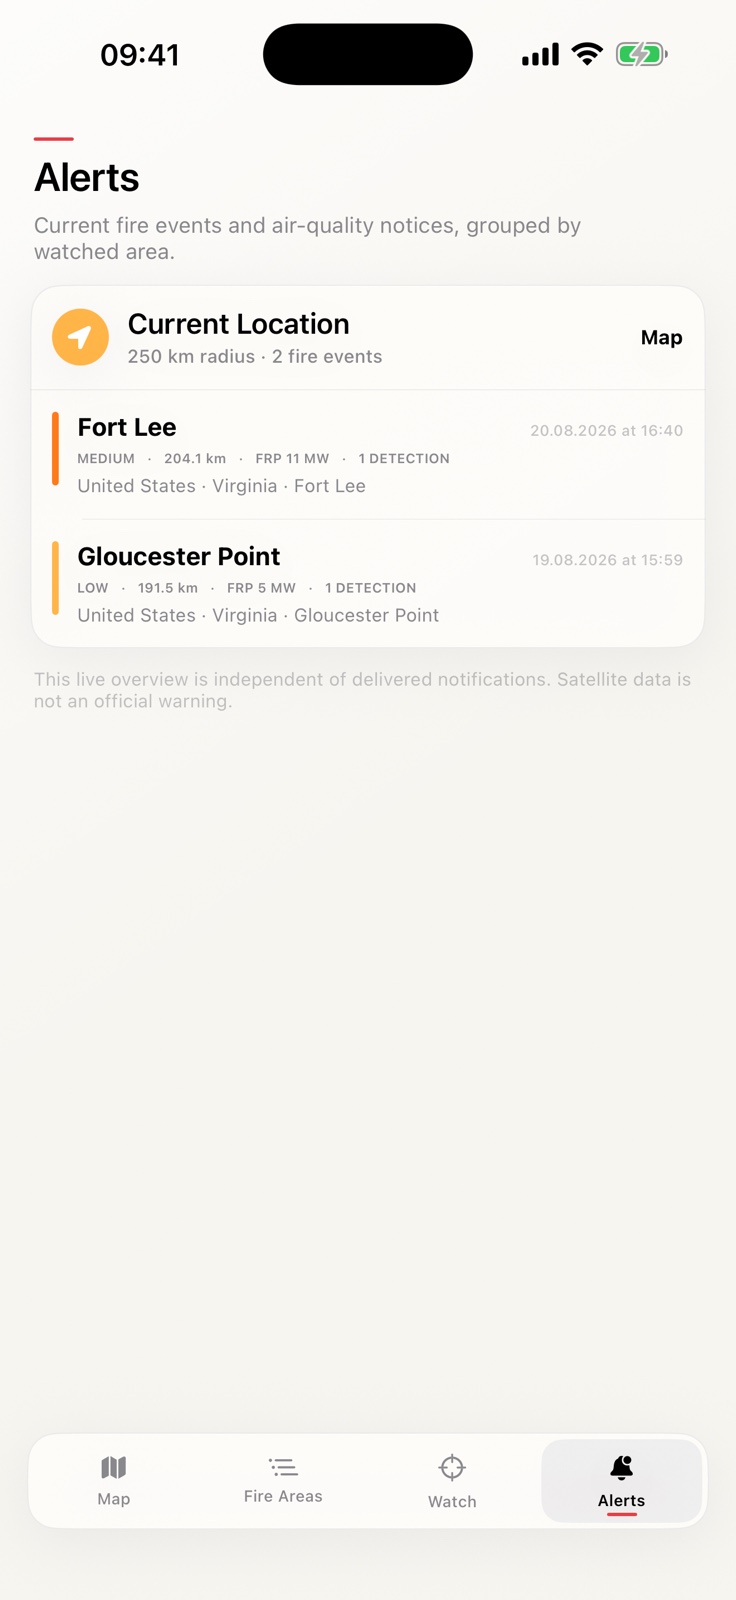
Active fire events
Nearby detections appear as one event. Colour and size indicate the measured heat intensity.
 FYRAVUE
Wildfires, air quality and smoke—worldwide in one app.
The map shows recent satellite detections, modelled air quality and smoke. Save the places that matter to you and keep an eye on the surrounding area.
Free for iPhone and iPad · Requires iOS 17 or later
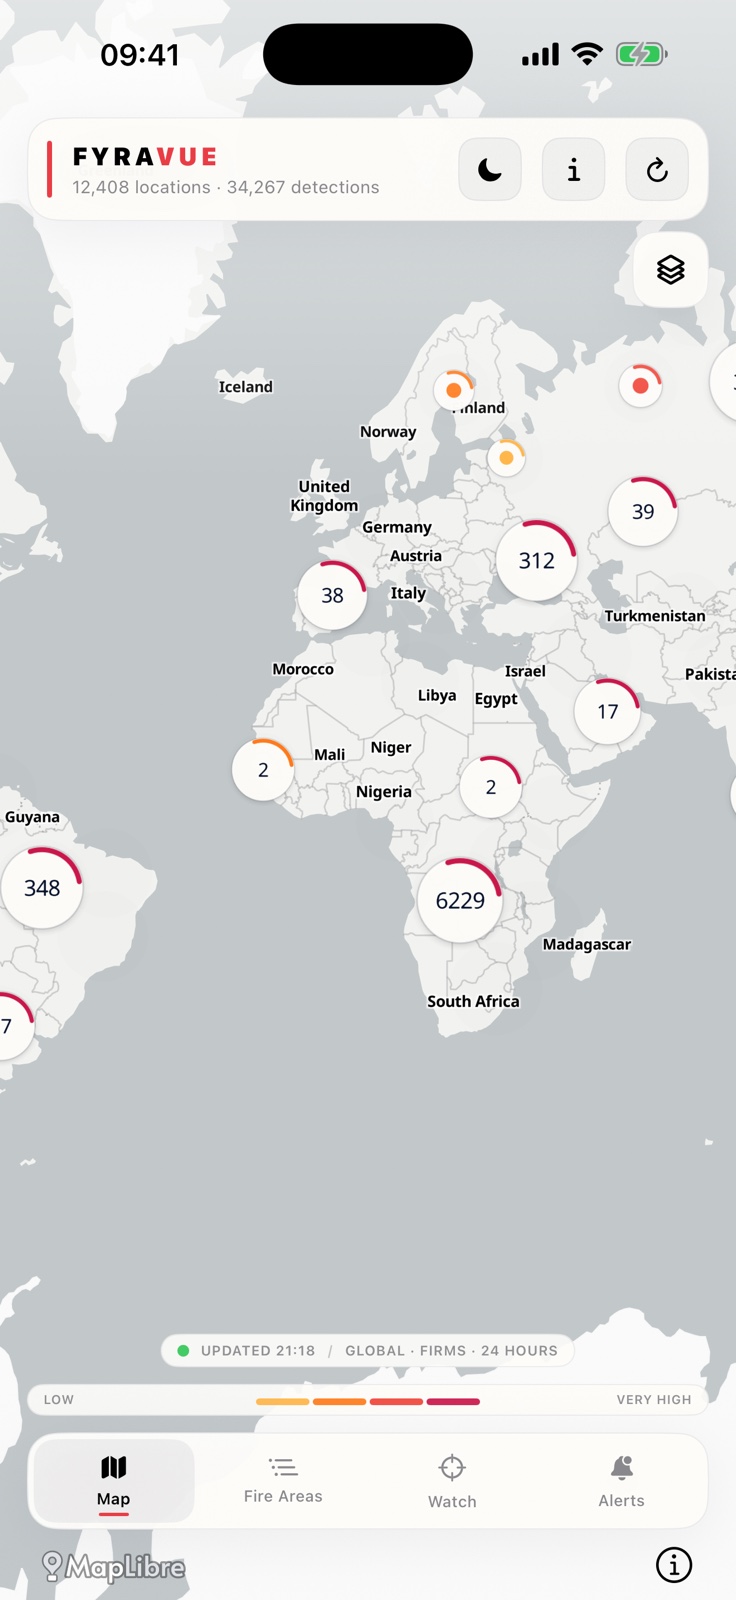
FYRAVUE does not show every satellite detection as a separate fire. Nearby measurements are grouped into events, making it easier to see what is happening in a region.
Nearby detections appear as one event. Colour and size indicate the measured heat intensity.
Air-quality and smoke layers show how atmospheric conditions around a place are being modelled.
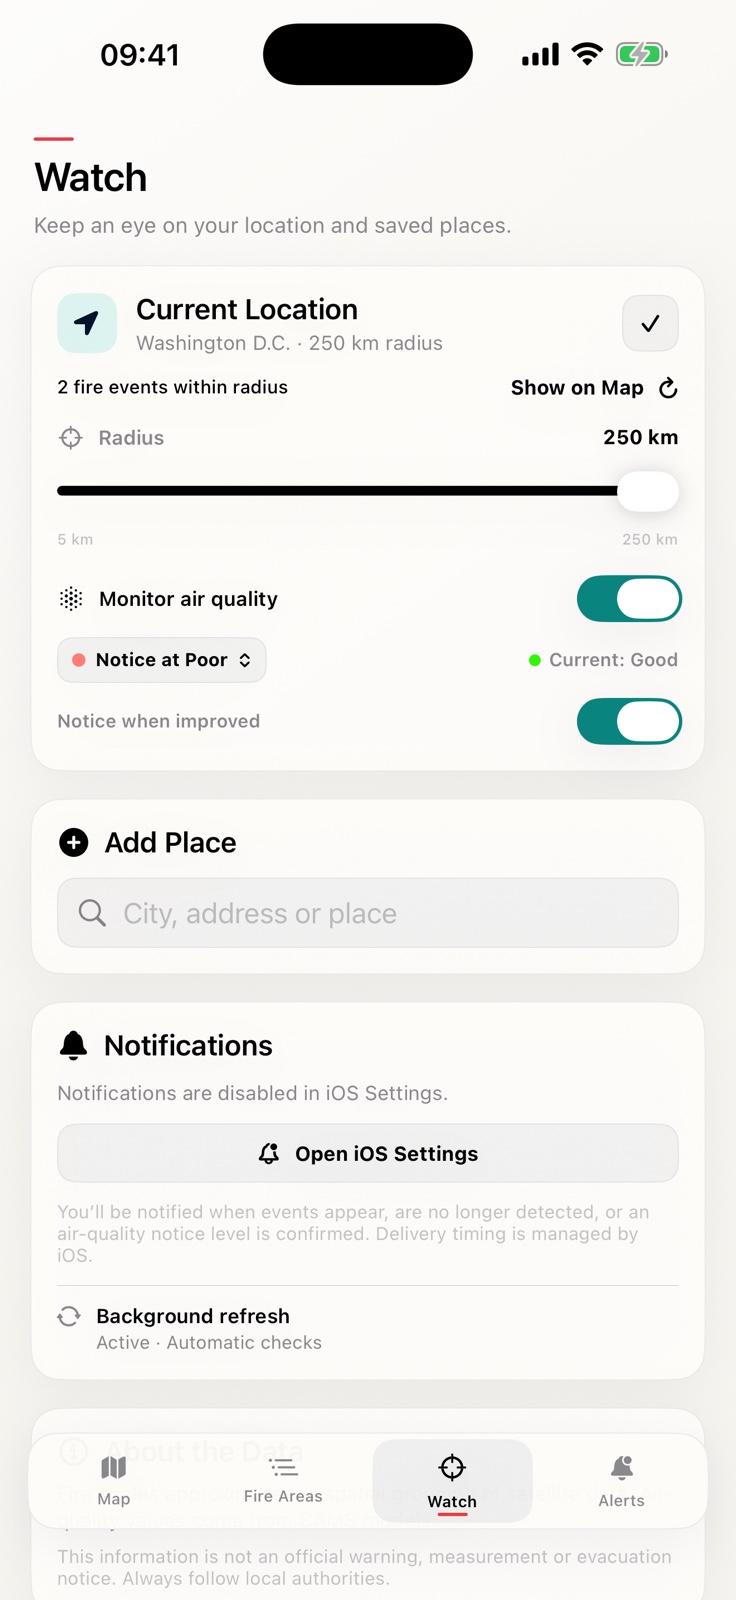
Use your location or save another place. Each watched area can have its own radius from 5 to 250 km.
Widgets show the status of selected places. In the app, you can review events that have appeared or are no longer detected.
Switch between map layers, then open dedicated sections for watched places and recent events.
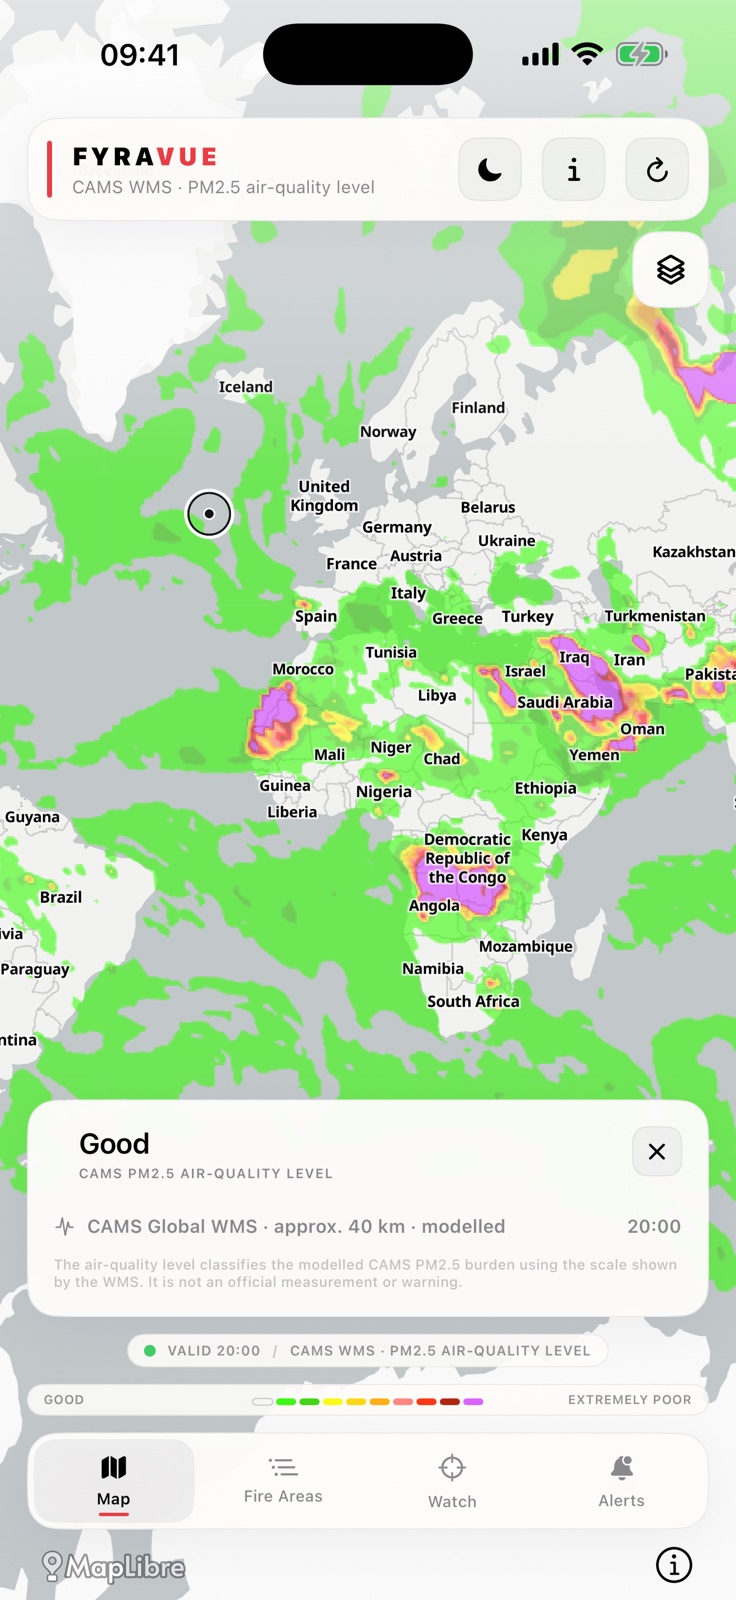
FYRAVUE uses NASA FIRMS data for active fires. Air quality and smoke come from Copernicus CAMS models. The source and valid time are shown in the app.
View all sources and licencesThe global MODIS dataset shows active-fire and thermal hotspots detected during the latest 24 hours.
Global and European models provide the basis for the air-quality and smoke layers.
These open projects provide the basemap, render it in the app and match places to their regions.
Support explains the data layers, location features, notifications and what the displayed values mean.